How can technology help in a humanitarian crisis
Grade 7
Presentation
Problem
Why did we choose this project and what was the problem for us to choose it?
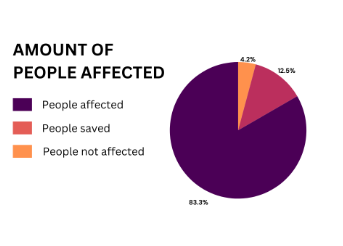
Due to recent wars, natural disasters, and humanitarian crisis, We thought of the idea of using science, computer science, and political science to create something to help the people in need. So for an example of this, we thought of the 2023 Turkey-Syria war. In this graph, it shows the number of people affected in the area by the earthquake in Turkey.
Now how can we lower these numbers of people affected, saved, passed away, etc? Well, its a simple answer but more complicated when we get into detail. We chose four different ways and of course, more can be used but these are what we think are the most effective in this cause.
- Mobile Alerts
- Coordination sensing and mapping
- Portable health care tents/machines
Now we will show you how we used these to go from that PI graph to this PI graph from the 12.8% difference.
Method
The materials used in the display of the heartbeat sensor:
- Arduino R3 or R4 board (Solder holes needed)
- Jumper wires
- Female to Male jumper wires
- Male to Male jumper wires
- Female to female jumper wires
- Any compatible OLED or LED display to show the results.
- Recomended: 0.96 inch OLED display
- or a normal TFT display
- Arduino compatible heart beat sensor
- Cardboard/Plastic/3D printed (Use either or) to create the cover for the heart beat sensor.
- Optional: Potentiometer used to change display contrast/brightness (Only available for TFT display)
How to make the heartbeat sensor:
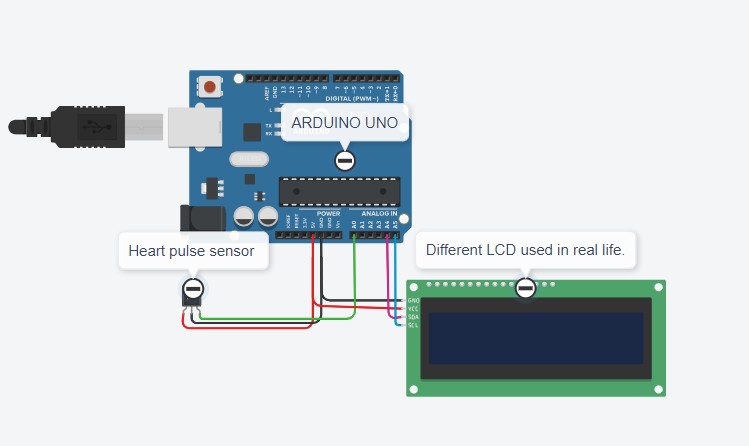
To make the heart beat sensor it contains simple steps of understanding while takes a while to make! It is very user-friendly and can be created by anyone ages 9+ if you are interested in computer science! This heartbeat sensor is controlled by an Arduino which is like a motherboard but is easier for anyone to connect wires and make anything. We started our project by making a diagram through Tinkercad.com circuit builder.
As you can see everything is wired to 5v (Five voltage), GND (Ground), Analog pins, etc.
Here is a quick introduction to what these unique names are for an Arduino!
- 5v: Five voltage is in the name. The voltage is what powers the Arduino, the Arduino has the capacity of five volts to power whatever it has. We used a fake Arduino to have solder holes to connect two wires to the heart pulse sensor and the LCD.
- GND: This is an abbreviation where it is "Ground". Ground is also very important as it measures the voltages going through this to be measured. It is emphasized to be important as without ground and a resistor a circuit may break.
- Analog pin: Analog pins are used to control and open up an LCD. When looking at the diagram we have you will see that all analog pins except for one are connecting to the LCD. Now why is that one not connected to the LCD? Well, that's an easy answer, when you want another circuit to communicate to the LCD to show results, analogs, menus, etc. You need one analog to be connected to that circuit to communicate and send to the other circuit (Which is the LCD)
- Resistor: A resistor holds voltages to make sure the right amount of voltage is being sent to a certain circuit. For example: If you have an LED which is a light and add it without a resistor it will either be the following: a) Not turn on at all. b) Go on fire c) break the entire circuit.
- LCD: An LCD is an abbreviation for liquid crystal display. On the display, we showed a TFT LCD we are using for our project a 0.96 OLED LCD which is a light-emitting diode. So that means that it creates light like a sun while using less power. Now the difference between the two is that the TFT is what would be used in your daily on-the-go calculator while for an OLED it would be like a phone and be pixeled and a lot more digital than the TFT.
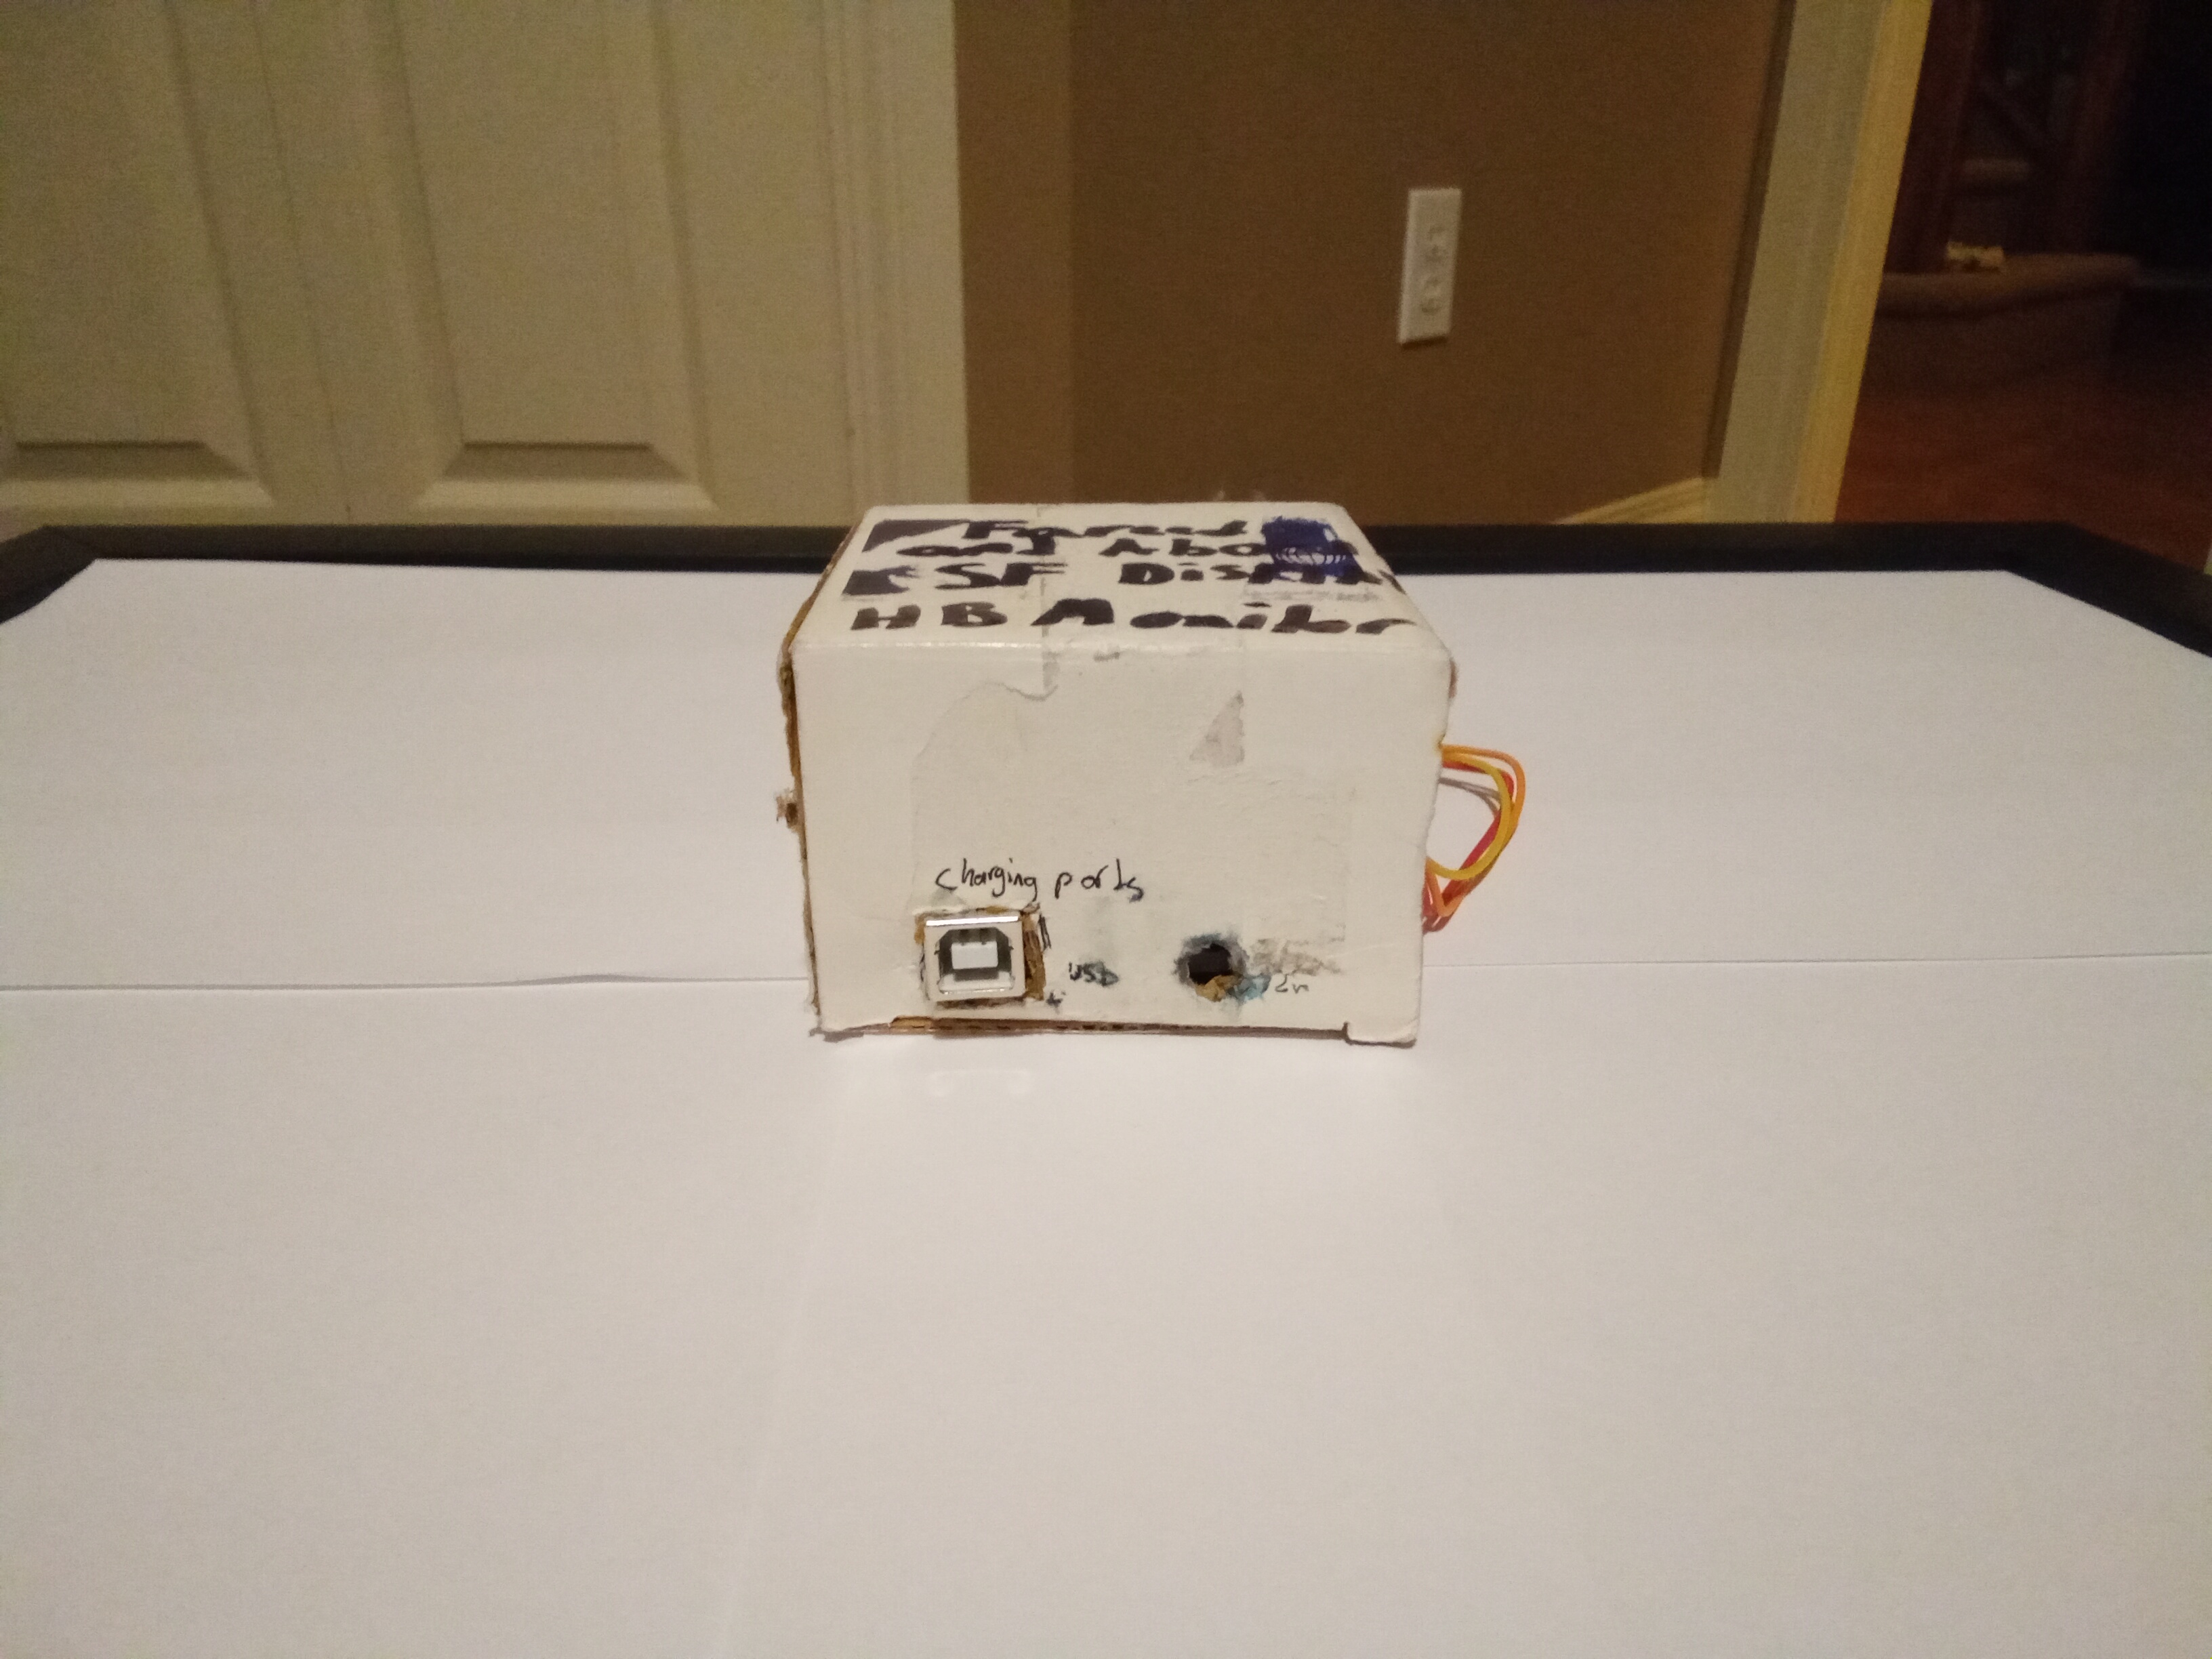
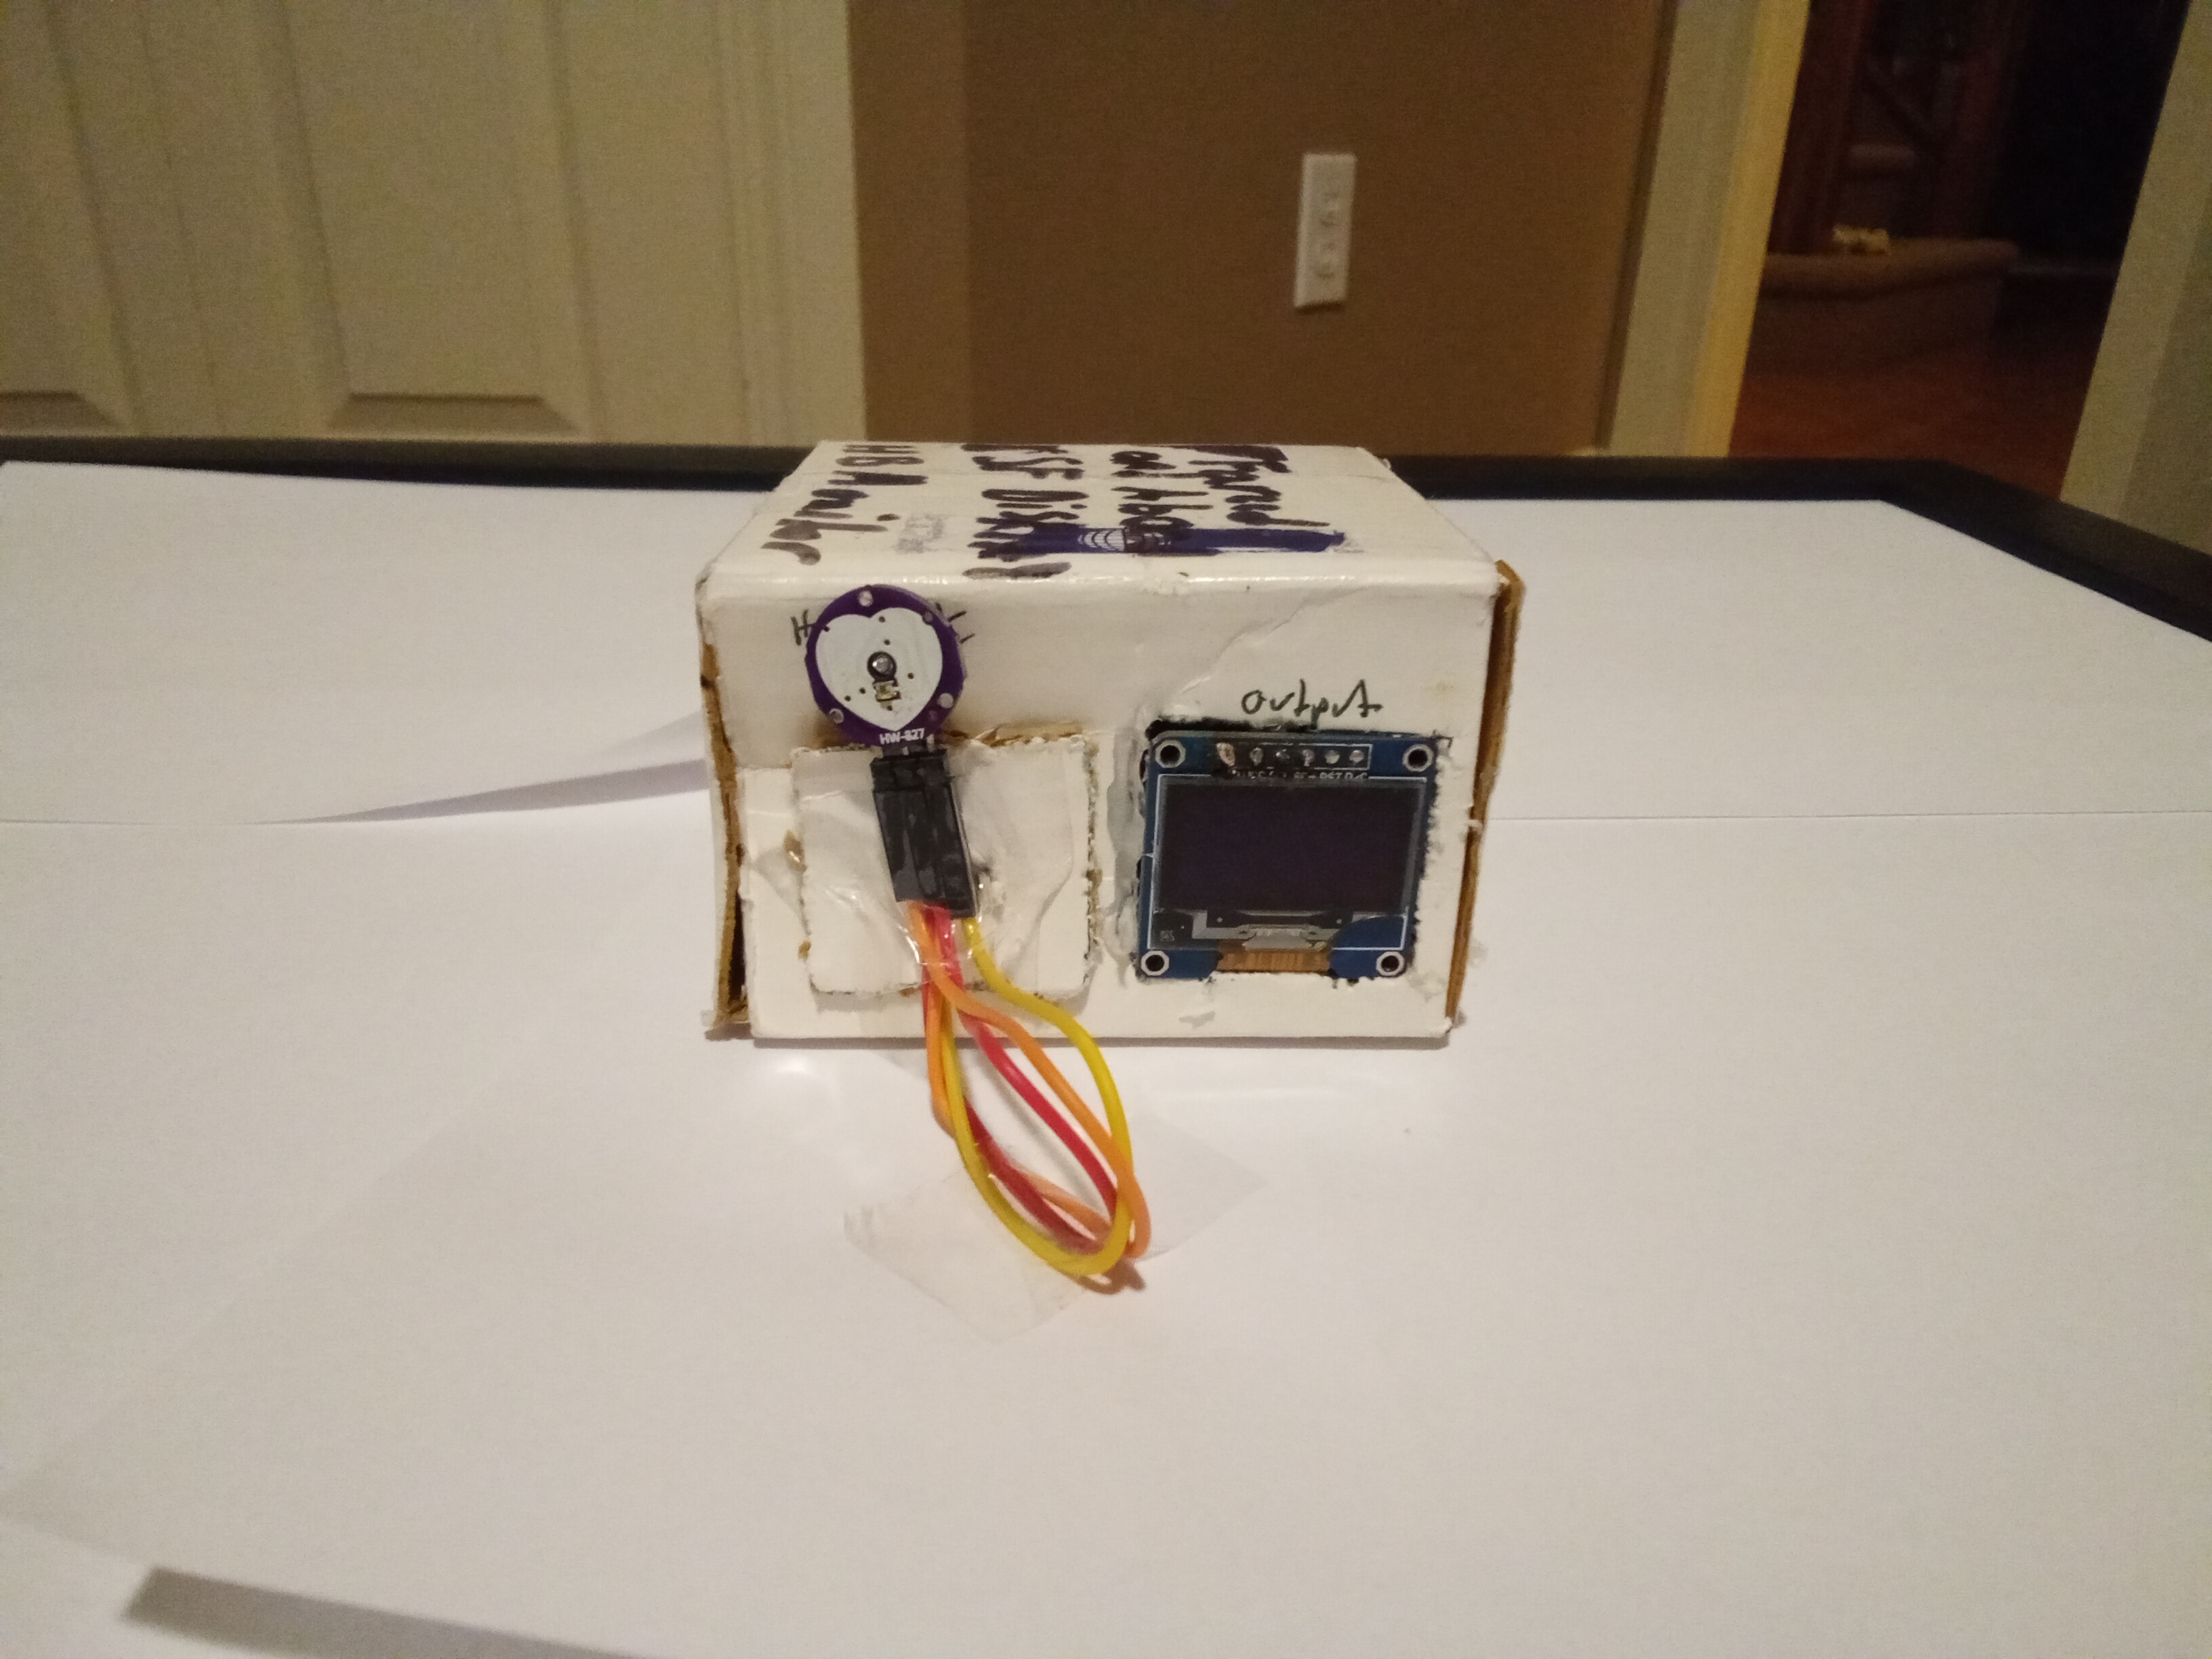
Now connecting all of these wires in real life is a mess and can be hidden/tidied by making a cover to keep everything in place. So we thought of the idea of a cardboard cut-out of a small box that is an easy on-the-go size.
Here are some photos of the inside and the box itself:
Ports:
Output:
Connecting the wires:
The wires are very easy to connect by just looking at the diagram and connecting it easily. The only problem is to solder the wires to the heartbeat sensor and OLED LCD. Which can be done by an adult. Connecting the wires are easy by using just looking at the display and if you want you can use different colors for organisation.
Analysis
To start with our project we have three ways on advanced technology that could be used!
- Coordinate mapping and sensing
- Mobile Alerts
- Portable healthcare tents
Coordinate mapping and sensing maps of the area where the earthquake is happening majority and where people who are stranded and in need are. So with that, it gives a full-out scan to show where they are.
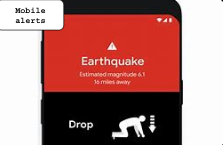
Mobile alerts are something used worldwide and are the most common. Now how can we enhance this? Well, it only happens to people with SMS. So it should be advanced to any device without SMS and on computers too! It should also be a requirement to be added to games, apps, etc to have a warning for these mobile alerts to be on anything.
According to statista.com/statistics/617136/digital-population-worldwide/ it states that in around January 2024, 62.3% (5.35 billion) people can access technology every day.
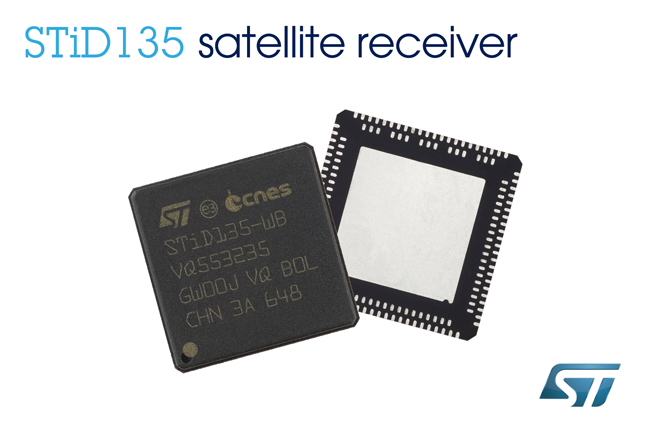
So this shows that around 62.3% of people can get this warning. Now what happens if a phone doesn't have wifi? Well, we could use a satellite signal. The satellite signal is a free signal used by satellites that orbit the Earth. So in simpler ways, it means this is free wifi. Now with this "free wifi," we could enhance or enforce technology to have a mini satellite chip that's able to be added to any phone for free. Using this anyone with a SIM card or without a SIM card can get these alerts.
Here is a display of what the satellite chip looks like:
This is a display of a mobile alert (i.e here it shows an earthquake with a diagram on what to do):
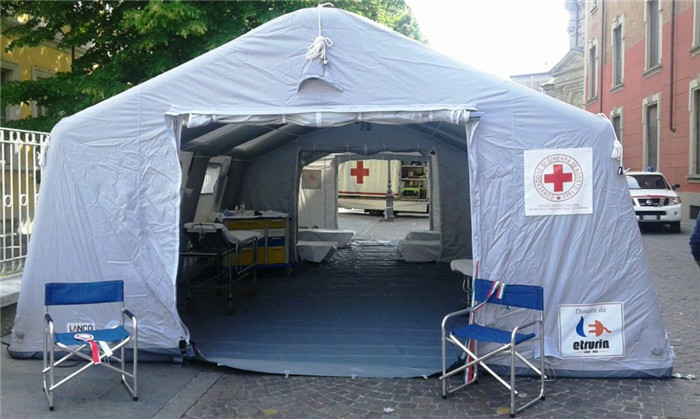
Lastly, we have portable healthcare tents. Now these may be confusing on how Healthcare tents can help and what even is a healthcare tent? Well, we will explain it to you here! A healthcare tent is a tent sent out by a hospital or a medical place that is used for recovery which uses and has all the required items to be sent out by trucks that unfold this tent. Now here's an example of how this will work. Now imagine my house is far away from a hospital and an earthquake happens. Now most probably I won't be able to get to the hospital if I'm injured because it's too far away and the roads are almost destroyed. Now what the hospital will do is that it will always have small trucks with a portable tent at the back that has all the items for use to help others. Now you might be thinking "How do these cars/trucks get through these roads?" Well, the first option is through the tires. Having good tires to go through would help a lot, but if the cracks of the road are huge and the rubble is massive then that becomes a problem. That's when you can carry it to the place because it's meant to be that portable. Just to unfold and reveal. Lastly, you could use helicopters but a lot of work would be used in putting it down, the time to go there and back, just how you're going to prepare it, and how many helicopters? So using the first option would be the best to save time and help immediately.
Now let's look at our graph! Our graph here is what we think will happen before those three examples are in action.
We found our graph according to linkedin.com/pulse/transformative-power-technology-humanitarian-aid-hared-msc-/. We also used worldvision.org/disaster-relief-news-stories/2023-turkey-and-syria-earthquake-faqs by using the turkey-syria earthquake. So we then estimated on people affected, saved, and not affected. Now this is not accurate of course but is what we think is a near estimation. We think that 4.2% is not affected as later on as you read you will see the math through it and how the lowest is going to be people not affected since we cant change that and since it's the lowest. People saved depended on how many hospitals were in the area.
According to google.com/search?sca_esv=5e1cf30a8e60a482&rlz=1CAYJDV_enCA1082&tbs=lf:1,lf_ui:2&tbm=lcl&sxsrf=ACQVn0_fANvbmmWTric1f7GexC2bEJACMQ:1709880626758&q=Gaziantep+hospitals&rflfq=1&num=10&sa=X&ved=2ahUKEwii0vbaieSEAxW-BDQIHfkVAZgQjGp6BAgaEAE&biw=1092&bih=478&dpr=1.25#rlfi=hd:;si:;mv:[[37.0934849,37.4327822],[37.0174145,37.3106104]];tbs:lrf:!1m4!1u3!2m2!3m1!1e1!1m4!1u2!2m2!2m1!1e1!2m1!1e2!2m1!1e3!3sIAE,lf:1,lf_ui:2. It shows how many hospitals are in the city of Gaziantep (the area affected of the earthquake). There are about 20 Hospitals and only 10 that are available to the public as the rest are private hospitals.

Amount of people affected in the area of Gaziantep*
As you can see we have the following table:
| People affected | 83.3% |
| People saved | 12.5% |
| People not affected | 4.2% |
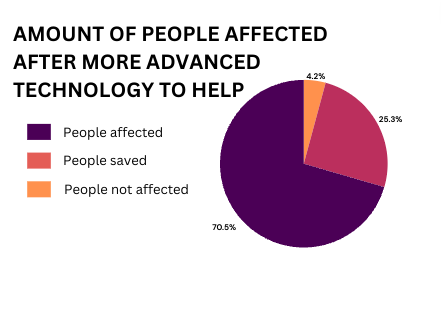
Now after those three examples are in action we think our graph will change from what was above to this graph:

Amount of people affected in the area after more advanced technology to help in Gaziantep*
|
People affected |
70.5% |
| People saved | 25.3% |
| People not affected | 4.2% |
Before we continue we have to show you our background work of 16% which will be very important going forward. Now since this is a humanitarian, computer science, health, etc project we have to show you our work on the humanitarian part of the project. So when we show you this graph of people affected and not affected this comes from the Turkey-Syria earthquake in 2023. So since it would take a lot of calculations and isn't exact due to borders closed, wars, etc we only counted Turkey.
According to worldvision.org/disaster-relief-news-stories/2023-turkey-and-syria-earthquake-faqs it says that around 15.7 million people were affected while others say around 14 million. So from around 15 million people in the entire population of Turkey (84.78 million) is around 16%. Now those graphs that we just showed you are a percentage inside of this 16%. Now when you continue reading you will see how this 16% is more important and how the graphs are related to the 16%.
Now how did we get this change from the beginning graph to the other graph? Well, that's a simple and complex answer. So first of all let's do the math for this.
Originally we got our graph from the 16% of people affected by the Turkey/Syria earthquake. So we changed that 16% into a fraction 16 over 16 which can be a whole number. So now we are imagining that this fraction is a whole number of 100. So now to find the number of people affected, saved, and not affected in numbers is by the following formula:
Note: (Since this is a circle graph it's a little different)
To convert a percentage to a number is to first turn the percentage into a chemical
So let's look at the people affected by advanced technology which is 70.5% the decimal is an easy 0.705 and since numbers are out of 100 then we multiply 0.705 by 100 which equals 70.5 which of course we could have just removed that percentage number to just get 70.5 but this is the mathematical and the formula to do it and makes sure your answer is correct!
Amount of people affected before advanced technology table (In numbers)
|
People affected |
83.3 |
| People saved | 12.5 |
| People not affected | 4.2 |
Amount of people affected before advanced technology table (In numbers)
|
People affected |
70.5 |
| People saved | 25.3 |
| People not affected | 4.2 |
Now how did we find that 12.8% difference? Now let's look at the People affected before and after in numbers.
| Graph before advanced | 83.3 |
| Graph after advanced | 70.5 |
Now since we are looking for the difference we have to minus the two. Meaning 83.3 - 70.8 = 12.8. Now to know the percentage we will just use our formula backwards to get 12.8%. This also is a 12.8% difference between the people saved but not with the people affected. Now why do the people not affected not change? Well, this is something logically that we can't change. This just depends on the situation as we cannot change how that works.
Now less math more computer! Let's see some comparisons on our display with other expensive or high-quality heart-beat sensors! Let's take for example the MD908B Patient Monitor 8 Inch Screen light weight and small size. Look at the table below you will see our comparison between our "product" and their product!
We got all our information about the MD908B patient monitor from orthopedicdrills.com/product/md908b-patient-monitor-8-inch-screen-light-weight-and-small-size/?attribute_modules=Only+Monitor&gad_source=1&gclid=CjwKCAiA6KWvBhAREiwAFPZM7k4bgmD_-nkD0Zhwpm6c7env5-qcLxSFCfB8iSXY2TkNefhLqEPk-xoCpRsQAvD_BwE&doing_wp_cron=1709879075.1139540672302246093750
| Our Heartbeat sensor | MD908B Patient Monitor | |
| Portability | Ours is an easy on-the-go product which can be put in your pocket. | The MD908B is made to be portable by being small but is the size of a tablet and wider. |
| Price | Our Heartbeat sensor is an easy and cheap price from $15-20 dollars. | The MD908B is VERY expensive at an outrageous price of $1,290 |
| Size | The top is 7cm and sidelength is 4.6cm. | The MD908B is 8 inches and has around a 5-6 inch width. |
| Accuracy | The accuracy of our heartbeat sensor is not the best as | The accuracy of the MD908B is spectacular as it is an approved and high-quality heartbeat monitor. |
| Assembly | Our project is an easy build-and-make project in which you can use plastic, cardboard, etc. Just follow the steps and it will easily be fixed! | The MD908B is made in a factory and has many things to assemble so if it breaks then you have to buy a new one. |
Sidenote: Our product may be better because of the cheapness, we found some well-known brands on Amazon and they were about $170 to $237 for one while our product is only about $13 to $20. Some are also like the MD908B at a $1,290 price!
Now a cool thing that we have found is that our heartbeat sensor created an entirely new measurement for the heart by using vibrations per millisecond. So if you don't have your heartbeat sensor on anything the output would come out as 1000-1500 vibrations, while on your finger it would be around 150 or jump to 700. For best results put your heartbeat sensor near your heart, the vibrations should be around 350 for Adolescence and may be lower for older ages. We would like to call this measurement pulsmillinovus (Pulse means vibrations in Latin, Millis is a millisecond, and Novus is new). Not only will this help in a humanitarian crisis by following the millisecond but it also can help through heart attacks by not only measuring the heartbeats but also the vibrations. This can be used to find the lowest vibration point in the artery to find the blockage.
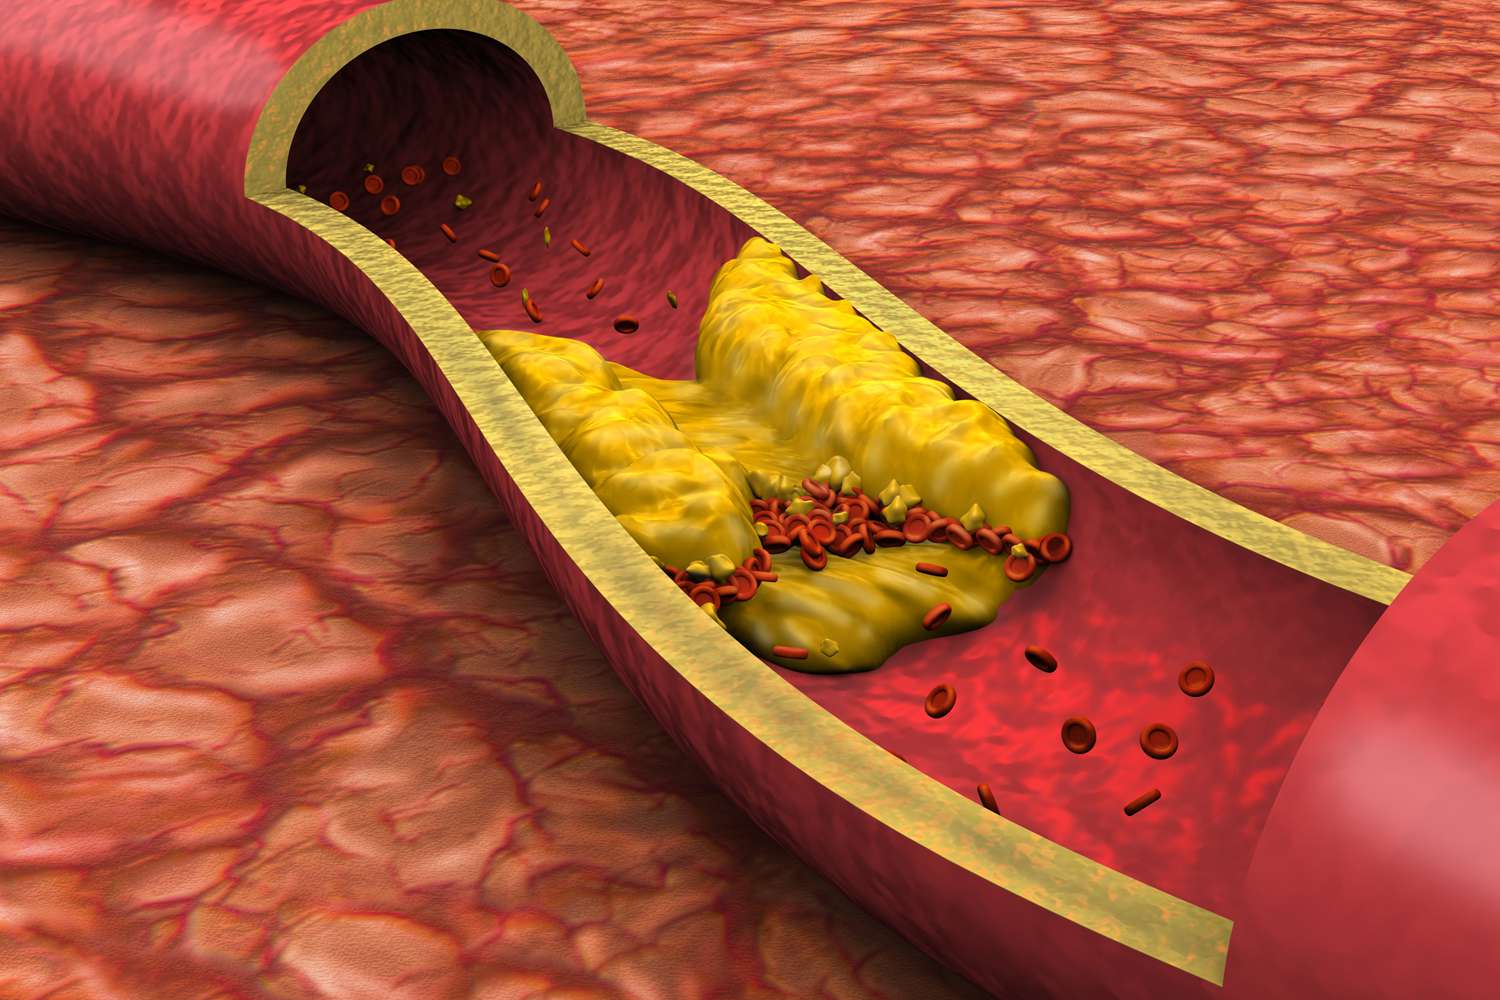
Image of artery blockage from verywellhealth.com/clogged-arteries-5190436
The con about the heartbeat sensor is that since it's going through vibrations per millisecond it's too much onto the LCD causing the LCD to not work, so the only way it will be able to work is through a computer.
Conclusion
Our research has successfully helped us to answer our question, “How can technology help in a humanitarian crisis,” the answer is that it can help by remote searching and mapping, portable medical stations using technology to show the nearest one, and using the entire thing of technology like big heartbeat machines, etc, and lastly the mobile alerts. These are shown by the graph which is used by an estimate of 12.8% of people saved from our example of the earthquake. To conclude and finish this off, with more technology and humanitarian funds put into technology for this matter we think that the millions of lives that have passed from casualties may lower in the coming years with our graph. Now with our display, we have good and bad news. Our display looks very nice and is portable! Now our display which is the innovation of our project on making something to save the world in a humanitarian crisis is not very accurate. Now of course you can use a watch, a machine, etc for your heart but this one is used on the go and meant with more accurate results and is medically approved if used in the real world. We would like to put an emphasis on "On-the-go" as thats the point of our display and our examples. We use on-the-go so that its easily accesible while escaping or going from a place to place without getting hurt or seeing your health to see if you need medical attention immediately.
Citations
In our project we used the following sites to help with research, display building, etc:
- hub, S. (2021, October 3). SrituHub - Tutorial on a heart beat sensor. YouTube. https://www.youtube.com/watch?v=aKus0FV4deU
- Heart beat sensor. SriTu Hobby. (2024, February 9). https://srituhobby.com/
- Google. (n.d.). Google. https://www.google.com/
- Bing. (n.d.). Bing. https://www.bing.com/
- From mind to design in minutes. Tinkercad. (n.d.). https://www.tinkercad.com/
- (MSc), M. H. (2023, September 6). The transformative power of technology in humanitarian aid. LinkedIn. https://www.linkedin.com/pulse/transformative-power-technology-humanitarian-aid-hared-msc-/
-
Team, T. A. (n.d.). Software. Arduino. https://www.arduino.cc/en/software/
-
Published by Ani Petrosyan, & 31, J. (2024, January 31). Internet and social media users in the world 2024. Statista. https://www.statista.com/statistics/617136/digital-population-worldwide/
-
We got our research on the MD908B from here: orthopedicdrills.com/product/md908b-patient-monitor-8-inch-screen-light-weight-and-small-size/?attribute_modules=Only+Monitor&gad_source=1&gclid=CjwKCAiA6KWvBhAREiwAFPZM7k4bgmD_-nkD0Zhwpm6c7env5-qcLxSFCfB8iSXY2TkNefhLqEPk-xoCpRsQAvD_BwE&doing_wp_cron=1709879075.1139540672302246093750
Acknowledgement
We would like to thank our science teacher for helping us organise and for ideas too! We also would like to thank our parents as they helped solder, had ideas, etc. Lastly, we would like to thank our friends who helped us understand some stuff we where stuck on, like math graphs, percentages, etc. Thank you to them!

