Temporal and Geographical Evolutionary Analysis of SARS-CoV-2 Pandemic Using Organic Bioinformatics Pipeline
Grade 10
Presentation
Problem
The COVID-19 pandemic affected the world majorly, and in a multifaceted way. To prevent disasters like it in the future, the world must study the effects of the virus, and use the lessons learned from it to advance medical technology. I decided to contribute to this effort in this project by conducting a temporal and geographical analysis of the genomic variations in the virus that causes COVID-19, SARS-CoV-2, over the course of its devastating reign.
My question therefore is: To what extent does geographical location and time period affect SARS-CoV-2 genomic neutrality, and what can be inferred from it?
BACKGROUND (No tab given on Website)
SARS-CoV-2 (Severe Acute Respiratory Syndrome CoronaVirus 2) is the virus that causes the respiratory infection COVID-19. The epidemic originated in China in late 2019, before spreading around the world. Many variants of the virus quickly developed, the most recent variant of concern was Omicron, which was first identified in Africa in 2023 and immediately showed increased Transmissibility.
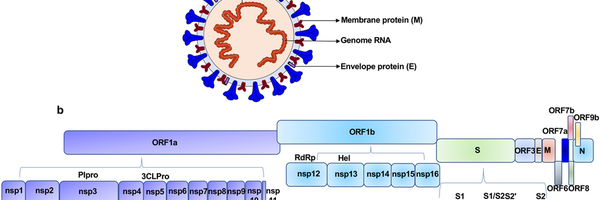
The genetic data of SARS-CoV-2 is stored in a single strand of RNA inside the virus, around 30 000 nucleotides in length, composed of 12 functional open reading frames (gene coding regions) that include instructions on the synthesis of viral proteins These include the spike proteins of the outer membrane which give the virus its signature "coronal" look, membrane proteins, and other structural and nonstructural proteins.
The genome of SARS-CoV-2 was sequenced quite early on in the pandemic, leading to a massive amount of genetic data. Bioinformatics is an interdisciplinary field of science that uses computer code to analyze these large databases. Programming languages used in this study to create a novel bioinformatics pipeline include R and C. The SARS-CoV-2 sequences are stored in a FASTA file format, which is a nucleotide list containing other supplementary information. Another critical file format used in this study is the VCF (Variant Call File), which stores variation data in a sequence.
Method
GITHUB CODEBASE: https://github.com/liaiwen8/SARS-CoV-2_Analysis
Genomic sequence data was downloaded from the GISAID EpiCoV database as FASTA files, which store nucleotide sequence data. The datasets used in the study other than the non-analyzed First Run sequences that were used to develop the pipeline were: 2019-May 2020 Global (9935 sequences), 2019-June 2020 Italy (1568 sequences), 2021 New Zealand (1723 sequences), 2022 Africa - Omicron Variants (2952 sequences), and 2024-January-February Global (221 sequences after filtering).
A test sequence population was selected to develop the bioinformatics pipeline at the start, but not analyzed: 2021 October to 2022 April, New York USA (12 FASTA sequences in total)
To detect genomic variations, Freebayes, a Bayesian (making predictions based on probability) haplotype based variant detector was used. The specific fork of Freebayes used was SARS-CoV-2-freebayes (Farkas et al., 2021). This library compiled a VCF (Variant Call Format) file, which stores genomic variation such as SNPs. The reference genome given to SARS-CoV-2-freebayes was the standard WIV04 reference from GISAID.
This VCF was then processed using original C code, which removed multi-nucleotide variations in the REF and ALT allele columns (neutrality testing usually only analyzes SNPs) and formatted it correctly for further analysis using a two-pass method.
A population file was also created using a C program (see GitHub for all code), a formatted tab-delimited text file with two columns comprised of the individual sample names for each sequence (extracted from the VCF file) and an overall population name.
The evolutionary analysis calculator used in this study was CATE (CUDA Accelerated Testing for Evolution) (Perera et al., 2023). CATE requires to be run on a cloud computing cluster, Compute Canada (also known as the Digital Research Alliance of Canada) was used. The formatted VCF and above population file was given to CATE's CTSPLIT function, which also created the necessary proprietary file structure that allows for CATE's efficiency.
Before beginning evolutionary testing, a genelist of SARS-CoV-2 must first be obtained. This is a formatted text file that contains data for each coding region (gene) in the virus' genome, such as start and stop coordinates. CATE requires it to be specifically formatted. R code was written to fulfill this task, first utilising the BiomaRt (BioConductor) library to query the Ensembl gene database and then formatting the resulting data into a genelist file. An alternative way to do this is to use CATE's GFF to gene function and provide it with the SARS-CoV-2 feature file from Ensembl.
A special processing C program had to be written for the 2024 data as many of the sequences downloaded from GISAID for recent 2024 populations contain many N bases, which means that they are unknown. To use the best available data, these must be filtered out. The C code deleted all sequences containing unknown RNA bases from the FASTA file.
Finally, all these culminate in running the CATE neutrality test function. Neutrality tests give insight into the variability of a genome, and can allow us to postulate about the timeline of a population. The tests that were used in this study are Tajima's D, Fu and Li's D, D*, F, and F*, and Fay and Wu's Normalized H and E. Note for Fu and Li's F*: vf* and uf* calculated based on the corrected equations in Simonsen et al (1995) (see CATE paper)
The results were opened in Excel for further analysis and annotation. A T-test statistical test was completed on the results. It compared the Global 2019-May2020 output and Global 2024 data output of each neutrality test (one-tailed, heteroscedastic). The P-values of the results were all significantly below 0.05, therefore the null hypothesis was rejected.
Research
Additional Background Information
The neutrality tests in this study measure deviations from the neutral theory of evolution, which states that evolution is solely caused by random genetic drift of selectively neutral nucleotide substitutions (do not alter an individual's survival rate). There are two types of changes from neutral theory, positive and negative selection. Positive natural selection is where haplotypes (gene regions, the alleles inside are normally inherited together) with a high amount of mutations are selected for. These variated alleles are usually beneficial, and positive selection is the main factor to adaptive evolution. Negative Selection (also called purifying selection) is where haplotypes and inidividuals with a low amount of mutations are selected for to continue their lineages, as in genomes that are quite similar to the reference ("most common" = ancestral) genome. This can happen in multiple ways, including a bottleneck or founder effect. It stabilises populations and can remove unwanted alleles that are deleterious.
The bottleneck and founder effects stated above relate to the concept of Genetic Drift, which is the natrual process by which completely random events cause changes in allele frequencies. A common model for genetic drift is the Wright-Fisher Model. Genetic Drift can cause the complete loss of alleles from a population, or the fixation of an allele (in 100% of individuals). The bottleneck/founder effects are similar, where only a low number of individuals remain in the population due to some random natural events.
Gene Migration (or Gene Flow) is also a major part of pandemic evolution, where variations in alleles occur due to mixing with foreign populations through population immigration or emigration.
NEUTRALITY TESTS BACKGROUND (Nielsen & Slatkin, 2016)
Tajima's D (1989)
Compares two measures of genetic diversity: Segregating Sites, positions in the genome where a variation is observed (ex. a specific locus of a SNP), and Pairwise Differences, the average number of nucleotide differences between pairs of DNA sequences in a sample (indicates the genetic diversity of a population).

Fu and Li's D, F, D*, F* (1993)
Extension of Tajima's D, but focuses on the distribution of singleton mutations in the population, meaning rare alleles that only a few individuals have, giving it an additional level of granularity. It compares the number of singleton mutations with the total number of mutations (D and D star) or the average number of mutations (F and F star). The star variations of the Fu and Li tests correct for specific biases that may be present in a population (introduced by the presence of segregating sites with only two mutations).
Fay and Wu's Normalized H and E (2006)
Fay and Wu's Normalized H is more sensitive to positive selection, therefore its values show positive selection events. Normalized E is more similar to all the other tests with minor improvements and caveats.
Data
All above mentioned neutrality tests were conducted on each dataset. The results were downloaded locally and analyzed in Excel.
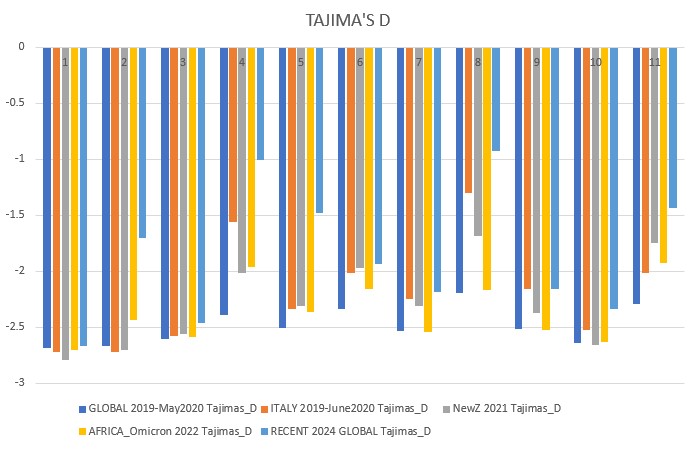
Tajima's D p-value = 0.00223
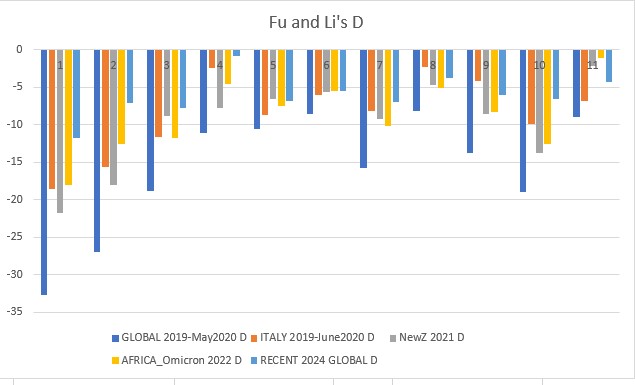
Fu and Li's D p-value = 0.00114
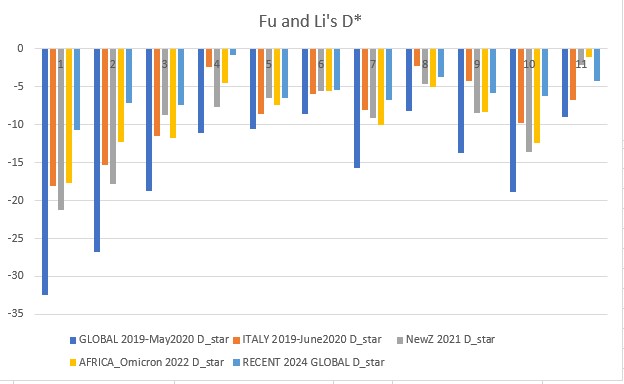
Fu and Li's D* (star) p-value: 0.00094
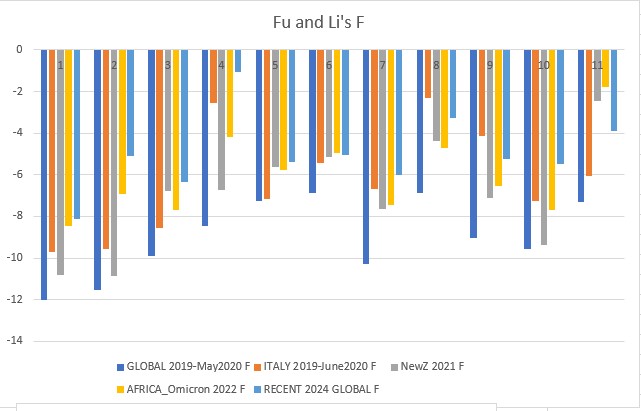
Fu and Li's F p-value: 0.00003
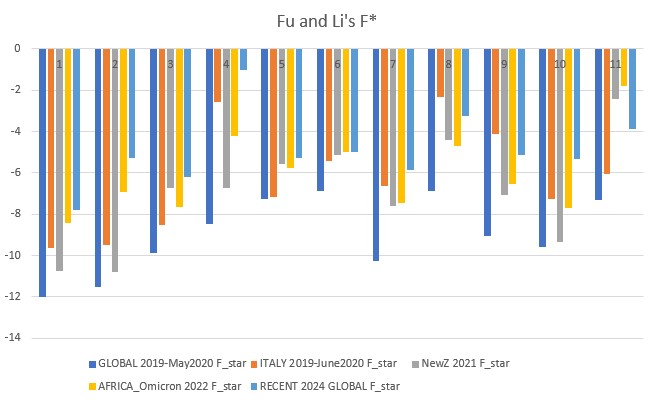
Fu and Li's F* (star) p-value: 0.00001
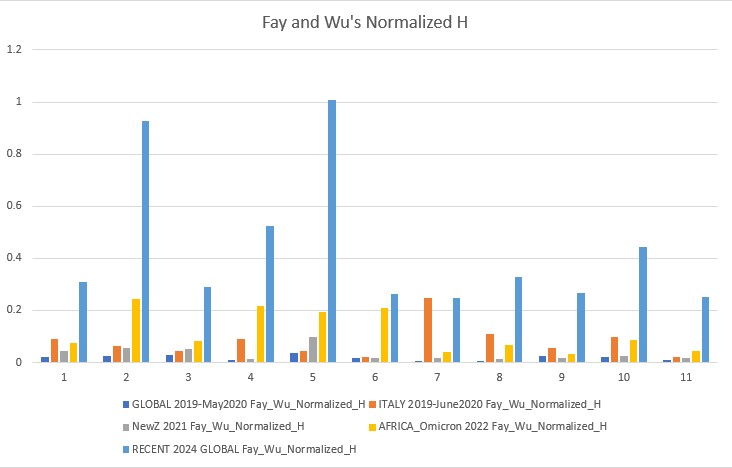
Fay and Wu's Normalized H p-value: 0.00022
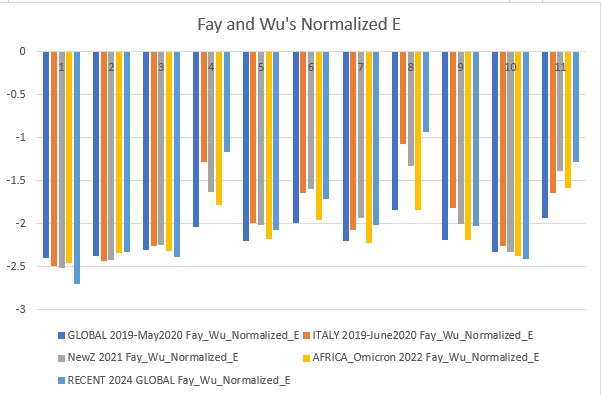
Fay and Wu's Normalized E p-value: 0.09609
Conclusion
SARS-CoV-2 majorly impacted the world, leading to widespread economic downfall, and the effects can still be seen today.
We can takeaway the following things:
- governments should take control of pandemics early like New Zealand, this will reduce virus variability and bring neutrality to the negatives, leading to a non-diverse population that can be effectively eliminated by vaccinations.
- developed countries must focus on helping densely populated, less rich countries with vaccinations as this is where hotspots can cause increased transmission and high positive selection (highly adaptable viruses). The Omicron variants were brewed in this type of environment, and to this day Africa has extremely low vaccination rates. Countries should also monitor outbreaks and investigate highly positive neutrality viruses. SARS-CoV-1 (SARS) was related to COVID19, meaning we may well see a third coronavirus that takes the world by storm. We must contain outbreaks and eradicate the virus when it starts to spread, and help under-developed countries so that they do not become a hotspot for new mutations.
- SARS-CoV-2 is beginning to rapidly evolve again, the 2024 data shows a sharp jump in neutrality towards positive selection. Our current vaccines still need to be developed and people must take boosters or else important factors such as the mutation of the spike protein gene could cause our current vaccinations to become overwhelmed and another pandemic wave may occur. The rise in neutrality I found towards less negative values means the virus could already be finding ways to circumvent our current vaccines, and this is something that needs to be further researched. ORF1ab (gene 1) and orf_S (gene 2, the spike protein gene) are very dynamic, which means they are undergoing more positive selection and again, may overcome the vaccines and be one step ahead.
Citations
References
Journal Articles:
Achaz G. Frequency spectrum neutrality tests: one for all and all for one. Genetics. 2009 Sep;183(1):249-58. doi: 10.1534/genetics.109.104042. Epub 2009 Jun 22. PMID: 19546320; PMCID: PMC2746149.
Cao, C., Cai, Z., Xiao, X. et al. The architecture of the SARS-CoV-2 RNA genome inside virion. Nat Commun 12, 3917 (2021). https://doi.org/10.1038/s41467-021-22785-x
Farkas, C., Mella, A., Turgeon, M., & Haigh, J. J. (2021). A novel SARS-COV-2 viral sequence bioinformatic pipeline has found genetic evidence that the viral 3′ untranslated region (UTR) is evolving and generating increased viral diversity. Frontiers in Microbiology, 12. https://doi.org/10.3389/fmicb.2021.665041
Nielsen, R. (2016, October). Fumio Tajima and the origin of modern population genetics. Genetics. https://www.ncbi.nlm.nih.gov/pmc/articles/PMC5068832/
Perera, D., Reisenhofer, E., Hussein, S., Higgins, E., Huber, C. D., & Long, Q. (2023). Cate: A fast and scalable CUDA implementation to conduct highly parallelized evolutionary tests on large scale genomic data. Methods in Ecology and Evolution, 14(8), 2095–2109. https://doi.org/10.1111/2041-210x.14168
Tajima, F. (1989, November). Statistical method for testing the neutral mutation hypothesis by DNA polymorphism. Genetics. https://www.ncbi.nlm.nih.gov/pmc/articles/PMC1203831/
Books:
Nielsen, R., & Slatkin, M. (2016). An introduction to population genetics: Theory and applications. Palgrave Macmillan.
Webpages:
Zhang, Y. (2021, November 7). Genome-wide Structure and Function Modeling of SARS-CoV-2 Virus. The Yang Zhang Lab. https://seq2fun.dcmb.med.umich.edu//COVID-19/
DeCamp, B., & Schmitt, C. (2020, November 1). AN333 Human Population Genetics. Lab 5 - neutrality statistics and selection. https://fuzzyatelin.github.io/AN333_Fall20/Lab5_Module.html
Trafton, A. (2021, May 11). A comprehensive map of the SARS-COV-2 genome. MIT News. https://news.mit.edu/2021/map-sars-cov-2-genome-0511
Acknowledgement
This study was conducted with use of software from CATE (https://github.com/theLongLab/CATE) (Perera et al., 2023) and SARS-CoV-2-freebayes (https://github.com/cfarkas/SARS-CoV-2-freebayes) (Farkas et al., 2021). Research was enabled in part by support provided by Compute Canada's Prairies DRI (through the University of Calgary) and the Digital Research Alliance of Canada (alliancecan.ca). A large proportion of of background research was studied from An Introduction to Population Genetics: Theory and Applications by Rasmus Nielsen and Montgomery Slatkin.

